English
 Vietnamese
 Italian
 Spanish
 Thai
 Japanese
 Portuguese
 Korean
 Russian
 French
 German
 Polish
 Indonesian
Power Inductor Reliability Testing for Industrial Switching Power Supplies
Engineers building industrial switching power supplies should place eight tests on the qualification plan: thermal cycling, thermal shock, vibration, humidity, solderability, insulation resistance, high-temperature load life, and DC bias verification of saturation current. Each test targets a specific stress path.
The power inductor carries concentrated risk in any switching supply. Core, winding, and solder joints all see thermal and mechanical cycling in service. These stresses drive most reliability issues in the magnetic path.
Power inductor reliability testing balances two costs. Over-testing lengthens qualification and raises unit cost. Under-testing invites field failures. The right test set matches the application, and this article shows how to build it.
Industrial Requirements for Power Inductors
Temperature, Vibration, and Lifetime Demands
Industrial switching supplies run continuously, often inside enclosures with limited airflow. Ambient temperatures stay high for years. Industrial-grade power inductors must therefore function across extreme temperatures, typically from -40°C up to +125°C or higher. Continuous duty magnifies every thermal margin decision.
Mechanical stress adds a second demand. High-speed rail, automotive, and demanding industrial settings make solder-joint strength, vibration resistance, and shock tolerance critical. A power inductor that survives bench testing can still crack at a termination after years of machine vibration.
Lifetime expectations set the third demand. Qualification programs extend load-life testing well beyond 1,000 hours, up to 5,000 hours. Teams then apply an Arrhenius-style extrapolation against a defined degradation criterion. Such extrapolations are specific to the tested parts, stress conditions, assumptions, and failure definition. Engineers should not generalize them as an all-inductor lifetime rule.
Industrial vs. Consumer and Automotive Profiles
Each market segment shapes inductor requirements differently. Consumer electronics prioritize miniaturized, compact high-density parts for thinner designs in smartphones, laptops, wearables, and smart home devices. Cost and size drive that profile, and shorter service life is acceptable. Industrial automation needs durable, high-efficiency inductors for continuous operation in robots, PLCs, sensors, and VFDs. Automotive demands high-current, high-temperature, compact parts driven by 800V battery platforms and ultra-fast charging, with AEC-Q200 compliance as the entry gate.
Segment | Usage rationale | Reliability focus |
Industrial control and automation | Long service life, potentially high ambient temperature | 24/7 operation, enclosure airflow, overload events, long-term thermal margin |
Automotive DC/DC converters | Compactness, mechanical robustness, high-current capability | Automotive-qualified series, vehicle thermal and electrical transients |
Consumer point-of-load buck converters | High current in compact PCB area | DC bias, ripple-current heating, continuous-duty temperature |
Margins shrink at temperature extremes. The rms current rating and saturation current headroom both fall as the core heats. An insufficient current rating shows up as inductance droop or thermal runaway. Defining requirements before testing prevents this mismatch. Key electrical parameters such as isat, self-resonant frequency, and rms current must be specified at the worst-case operating temperature, not at room ambient.
Essential Power Inductor Reliability Testing
Power inductor reliability testing rests on a defined set of stress tests. Each test reproduces one field stress and exposes one failure mechanism. Engineers should treat this test set as the backbone of any qualification plan.
Thermal Cycling and Thermal Shock
Thermal cycling moves the part between low and high temperature limits at a controlled ramp rate. The slow ramp lets the whole assembly expand and contract together. Thermal shock applies the same extremes with a near-instant transfer. The steep gradient stresses the interface between materials with different expansion rates. Both tests target core cracking, winding fatigue, and solder-joint cracking. Thermal shock is the harsher screen for termination integrity. Thermal cycling better simulates daily ambient swings in an enclosure.
Vibration, Humidity, and Solderability
Vibration testing shakes the mounted part across a frequency sweep. It targets mechanical fatigue at the solder joints and any loose core assembly. Humidity testing holds the part at high temperature and high relative humidity. Moisture ingress degrades insulation and corrodes the winding. Solderability testing checks that terminations wet properly during assembly. A poor wetting result predicts weak joints before the part ever enters service.
Solderability and humidity tests catch winding and termination weaknesses that thermal tests alone miss. Thermal stress reveals expansion mismatch. It does not reveal a termination that resists wetting or a winding that absorbs moisture over time. These two tests close that gap.
Test | Typical stress profile | Acceptance focus |
Thermal cycling | Repeated low-to-high excursions at a controlled ramp | No core cracks; inductance shift within limit; DCR stable |
Thermal shock | Rapid transfer between temperature extremes | No termination or solder-joint cracks; insulation intact |
Vibration | Frequency sweep on the mounted part | No joint fatigue; no core loosening; stable parameters |
Damp heat / humidity | Elevated temperature with high relative humidity | Insulation resistance above minimum; no corrosion |
Solderability | Controlled solder dip at specified temperature | Full termination wetting; no dewetting or voids |
The table gives typical profiles and acceptance focus. Exact limits come from the chosen standard and the application. A power inductor that passes thermal stress but fails solderability still poses a reliability risk in production. The test set works as a whole, not as isolated checks.
Insulation Resistance and Load Life
Insulation resistance measures the isolation between the winding and the core over time. A high reading confirms a sound enamel coating and a clean bobbin. Moisture, thermal aging, and voltage stress erode that barrier slowly. A falling insulation resistance signals breakdown risk before a short circuit appears.
High-Temperature Load Life and Drift
High-temperature load life runs the power inductor at rated current and elevated temperature for an extended period. The test exposes long-term inductance and dc resistance drift. Both parameters shift as the core ages and the winding settles. Drift matters because loss modeling depends on stable values. A rising dc resistance adds winding loss. A falling inductance raises ripple current and ac core loss. Together they push temperature rise upward. Engineers compare drift against the initial reading and against the datasheet tolerance.
DC Bias and Saturation Current Checks
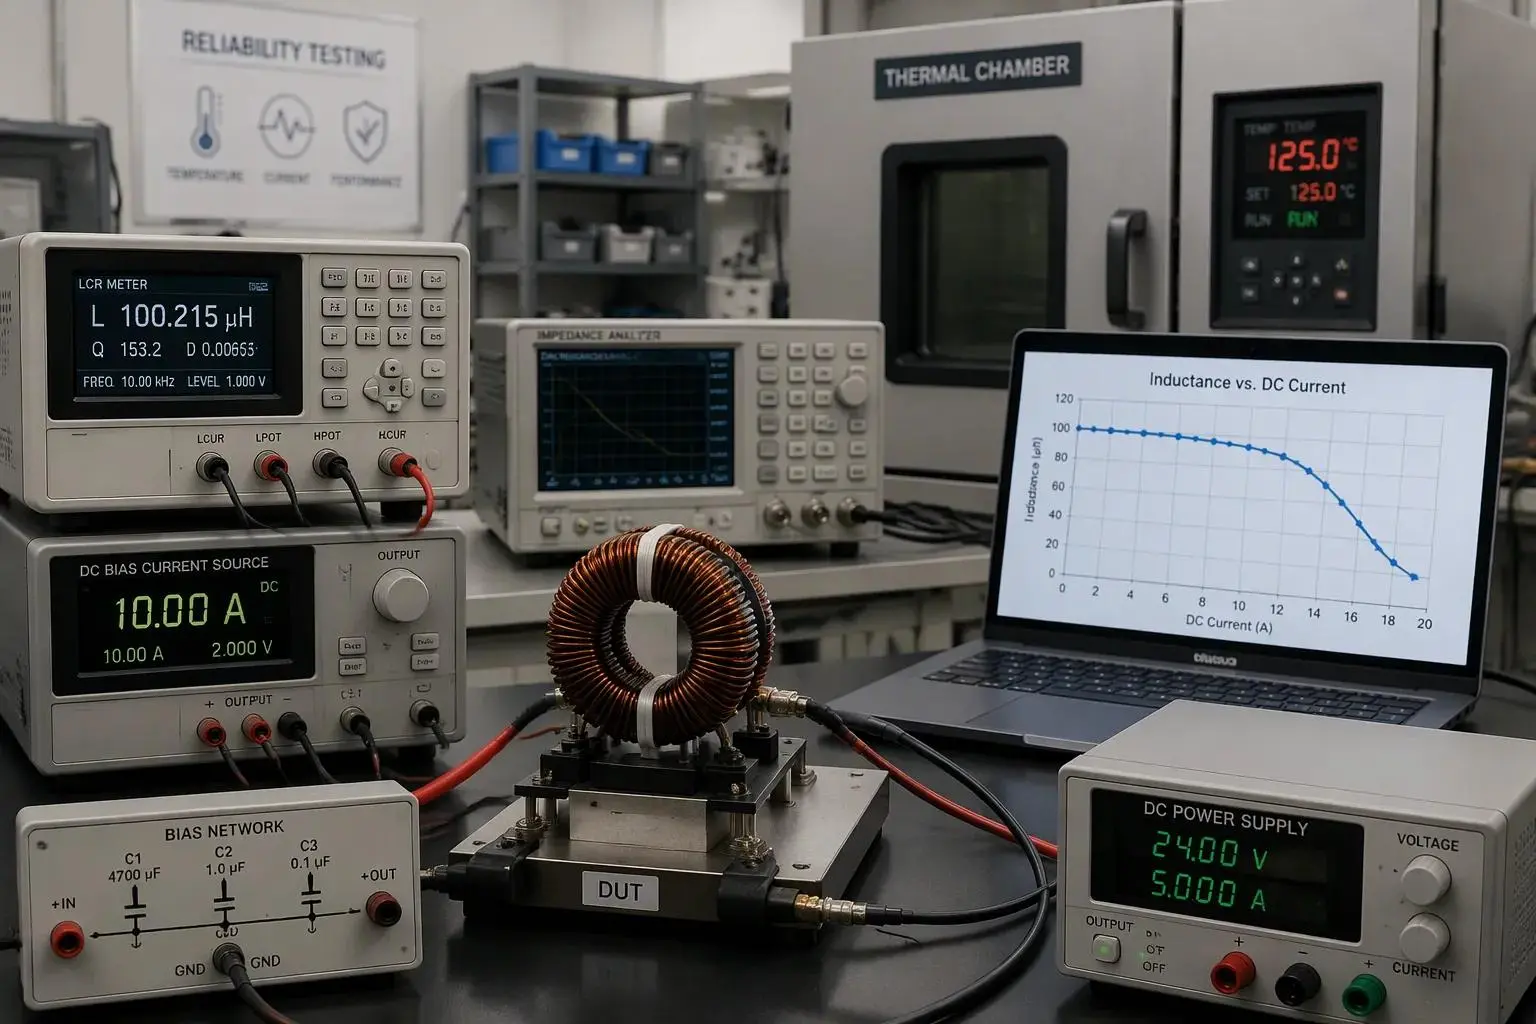
DC bias testing superimposes a DC current on the AC measurement signal. The setup needs an LCR meter or impedance analyzer, a controlled DC source, and a bias network that isolates the instrument from DC. The engineer first matches the datasheet conditions for frequency, AC level, and temperature, then performs open and short compensation. Inductance at zero bias becomes the reference L0. Current then rises in controlled steps, with inductance and temperature recorded at each step. The measured isat is the DC current where inductance falls by the manufacturer's stated criterion.
Inductance-drop criterion | Resulting inductance for a nominal 10 µH part |
10% reduction | ~9 µH |
20% reduction | ~8 µH |
30% reduction | ~7 µH |
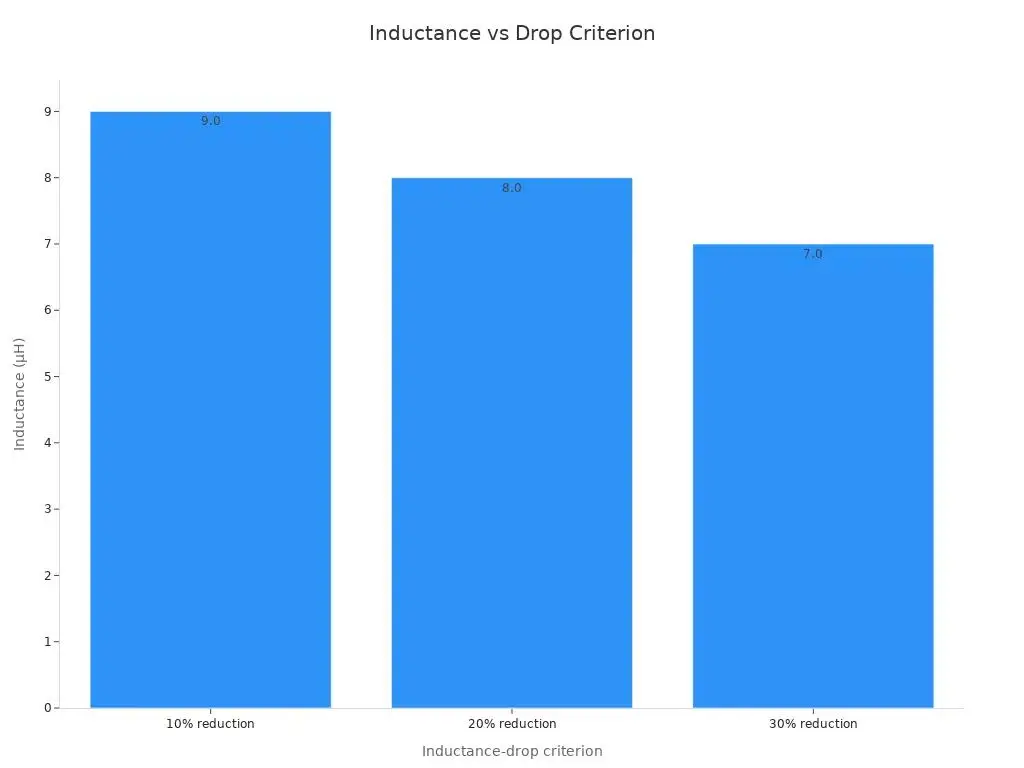
No single drop percentage is universal. A part rated at 30% drop may show a higher isat rating than one rated at 10%. Comparisons only hold when the drop definition and test conditions match. The engineer should also read the L-versus-I curve at every current the circuit sees: normal operation, steady-state peak, startup, and transient. A nominal 10 µH part may deliver only 7.5 µH at the operating point, and converter calculations must use that remaining inductance. Core material shapes the curve. Ferrite cores show a sharp saturation knee, while powder and metal-composite cores decline gradually. An insufficient current rating shows up as a soft knee crossed too early. The peak saturation current must therefore sit above the worst-case load with margin, and the saturation current rating must hold across the full temperature range.
Standards and Acceptance Criteria
AEC-Q200, IEC, and MIL-STD Mapping
Each test on the qualification plan traces back to a named standard family. AEC-Q200 (Rev-E, 2023) serves as the primary stress-test qualification standard for passive components, and it explicitly covers inductors and magnetics. It adds AEC-specific tests on top of base methods, including biased-humidity life at 1000 hours, 85 °C, 85 %RH with rated bias, plus terminal strength. IEC 60068 supplies the base environmental and mechanical test methods that AEC-Q200 references. MIL-STD-883 and the JEDEC JESD22-A series sit alongside it as underlying base standards. AEC documents build on these methods but do not replace them.
AEC-Q200 covers everything that is not a semiconductor: capacitors, resistors, inductors, magnetics, varistors, fuses, and crystals.
Industrial designs often borrow automotive test levels selectively. A designer may adopt the biased-humidity life profile for a sealed enclosure application and skip a vibration sweep the mounting method already addresses. That selective borrowing works when the engineer documents the rationale.
Reading Acceptance Criteria Correctly
Pass/fail thresholds need careful reading. Inductance change limits define how far the value may drift from the initial reading. DCR shift limits cap the rise in dc resistance. Insulation resistance minimums set the floor for winding-to-core isolation. Visual criteria cover core cracks, termination wetting, and marking legibility. A power inductor meets the plan only when every criterion passes together.
Copying a standard's default levels without checking them against the application invites trouble. A default saturation current margin may assume a benign ambient the enclosure never delivers. The current rating and rms current headroom must reflect the real worst case. Engineers should confirm each threshold against field conditions before signing the plan.
Interpreting Results and Failure Modes
Core Cracking, Winding Fatigue, Solder Joints
A failed power inductor usually shows one of five signatures. Core cracking appears as a visible fracture after thermal shock or mechanical shock. Winding fatigue shows up as a broken or shorted turn after repeated expansion and contraction. Solder joint cracking surfaces at the termination after vibration or thermal cycling. Insulation breakdown reveals itself as a falling insulation resistance reading. Inductance drift appears as a slow shift in value across load life.
Each signature points to a different root cause. A crack along the core edge suggests a thermal gradient the part could not absorb. A fatigued winding suggests the copper and the core moved at different rates. A cracked joint suggests the mounting method or the solder profile, not the magnetic design. Engineers should record the failure location before replacing the part.
Wear-Out vs. Early-Life Failures
Test sequencing separates the two categories. Early-life defects appear in the first hours of a stress test. Wear-out mechanisms appear late and grow steadily. A part that fails at hour 100 of a 1,000-hour load life test carries a defect. A part that drifts after 4,000 hours shows normal aging. Failure analysis then confirms the mechanism through cross-sectioning or microscopy.
Consistent construction reduces the variation that complicates this reading. A manufacturer with in-house magnetic material selection and IATF 16949 processes holds unit-to-unit spread tight. Tight spread makes a drift trend visible against a stable baseline. Loose spread hides the trend inside normal scatter.
Watch for an insufficient current rating during interpretation. A part that overheats at rated rms current may show rising dc resistance and falling inductance together. That pattern reflects winding loss and core loss climbing past the thermal design, not a random defect. The saturation current margin and the current rating must both hold at the worst-case temperature before the engineer clears the part.
Matching Test Levels to Applications
Deriving Profiles from Field Conditions
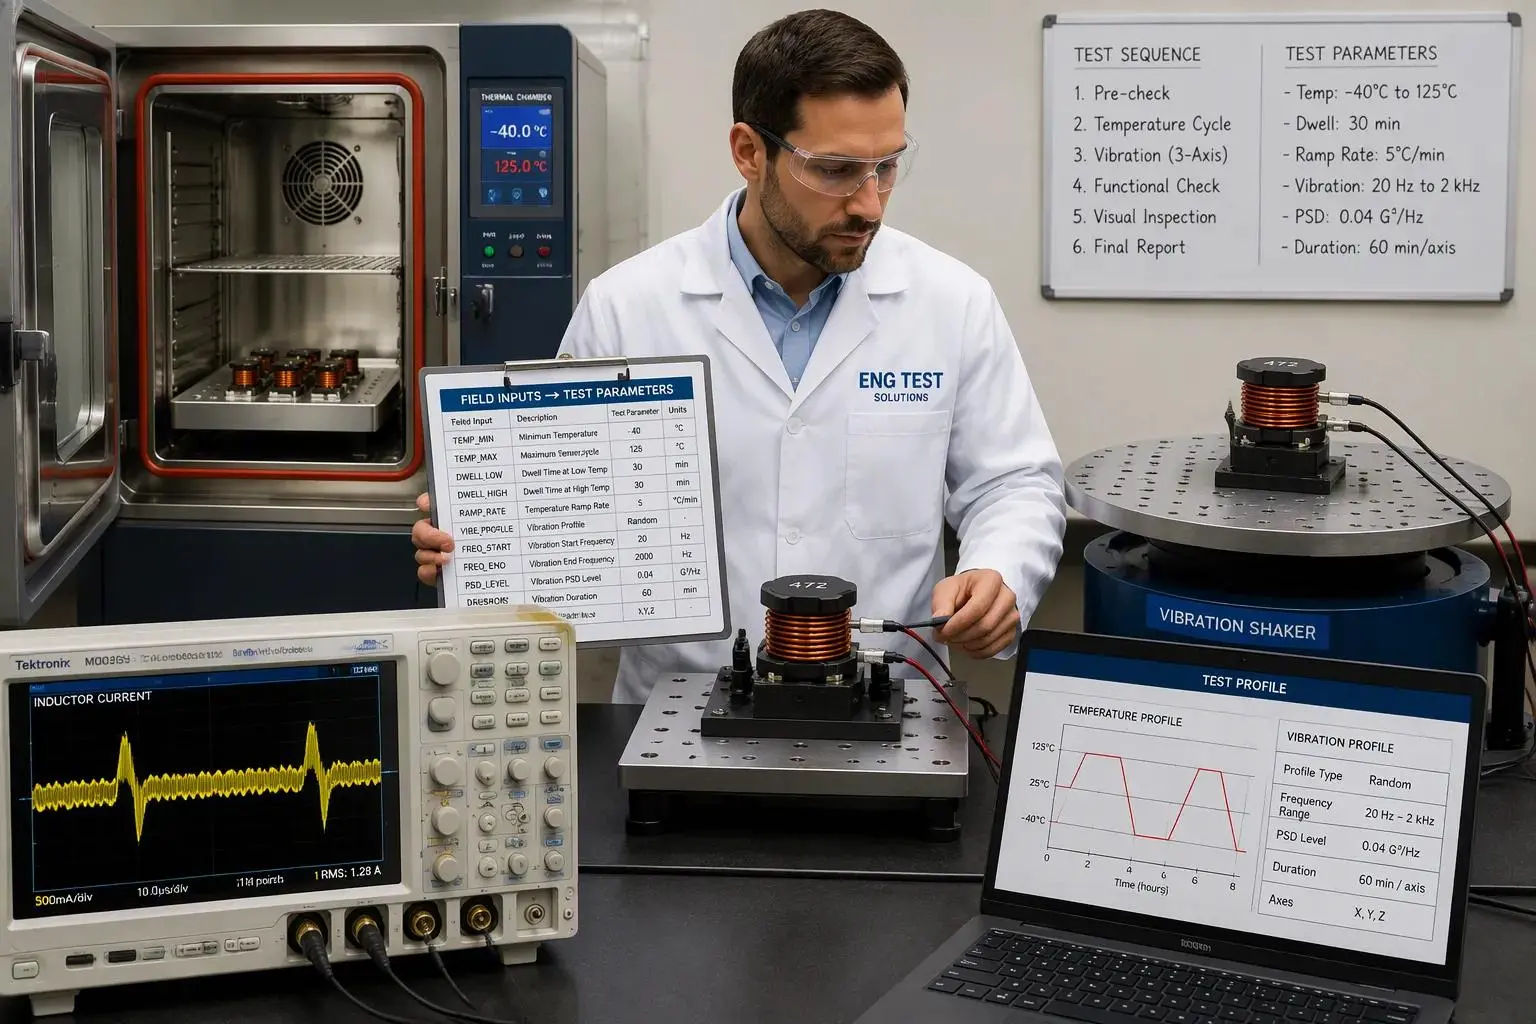
A test profile should mirror the field environment, not a generic datasheet default. The engineer starts with three inputs: the ambient temperature range inside the enclosure, the vibration spectrum of the mounting location, and the duty cycle of the load. Each input maps to a specific test parameter.
Field input | Test parameter it sets |
Enclosure ambient range | Thermal cycling low and high limits, soak duration |
Mounting vibration spectrum | Vibration sweep band and acceleration level |
Load duty cycle and peak events | Load life duration, bias level for DC bias sweeps |
The worst-case load deserves special attention. The engineer must tie the current rating and saturation current margins to the heaviest load the circuit will ever demand, including startup and transient peaks. A power inductor sized for nominal load alone will droop when the transient arrives. The isat rating must clear that peak with headroom at the highest operating temperature, where saturation current falls. The rms current rating must cover the steady-state heating, and the resulting temperature rise must stay inside the thermal design. Ripple current adds ac loss on top of the dc heating, so the profile should reflect the real ripple at the switching frequency.
Avoiding Over-Testing and Under-Testing
Over-testing carries a visible price. Extra test lots, longer durations, and repeated failure analysis stretch the qualification schedule and raise unit cost. A vibration sweep copied from an automotive program may add weeks to a plan for a part bolted inside a stationary cabinet. That effort buys little confidence.
Under-testing carries a hidden price. A skipped humidity test or a loose saturation current check can pass a part that fails in the field. Field failures cost far more than the test time they would have consumed. The engineer should place each test where the application risk justifies it.
One practical shortcut exists. One-stop selection and testing support from an experienced inductor manufacturer shortens this matching step considerably. A supplier with in-house magnetic material selection can propose a profile from the application description, supply samples for verification, and confirm the isat and rms current data against the real operating point. That support turns sizing and selecting inductors from a guess into a documented decision. The engineer still owns the final acceptance call, but the matching work starts from tested data rather than a blank page.
The goal is a right-sized plan. Every test on it answers a field risk the application actually presents. Power inductor reliability testing works best when the profile follows the field conditions, and the current margins follow the worst-case load.
Cost and Compliance Considerations
Where Qualification Cost Comes From
Qualification cost accumulates from four sources. The number of test lots sets the base cost, since each lot consumes parts, fixture time, and lab hours. Test duration multiplies that base, and a long load-life run ties up chambers for weeks. Failure analysis adds cost whenever a sample fails, because cross-sectioning and microscopy demand specialist labor. Re-qualification after a design change restarts part of the cycle, and a late change can wipe out an entire completed plan.
Cost driver | What it consumes |
Number of test lots | Parts, fixtures, lab hours per lot |
Test duration | Chamber time across the full run |
Failure analysis | Specialist labor per failed sample |
Re-qualification | Repeat of affected tests after design changes |
A power inductor sits at the center of this budget. Its core loss and winding loss behavior determines how much thermal testing the plan needs. A part with generous saturation current margin needs fewer re-runs than one pushed close to its limit.
Building a Right-Sized Test Plan
A right-sized plan starts from application conditions, not from a standard's full menu. The engineer selects the essential tests first, then adds optional tests only where a specific risk justifies them. A sealed enclosure may justify the humidity test and retire a vibration sweep the mounting method already handles.
Component type should guide the plan as well. Ferrite-core inductors fit high-frequency switching power supplies and EMI roles, where core loss and self-resonant frequency dominate the design. High-current toroidal inductors fit energy storage and filtering, where saturation current and rms current headroom matter most. The engineer should choose the type that matches the application rather than testing every type to every level. That choice keeps inductance, current rating, and ripple current margins aligned with the real duty, and it keeps the qualification budget pointed at genuine field risk.
The essential test set covers thermal cycling, thermal shock, vibration, humidity, solderability, insulation resistance, load life, and DC bias. Engineers read results against drift limits and failure signatures, then right-size levels to field conditions.
A practical checklist guides selection and qualification:
1. Define the application and worst-case operating conditions.
2. Determine required inductance, ripple, and peak current.
3. Screen datasheets under bias and temperature, not nominal values.
4. Verify isat clears the peak transient at maximum temperature.
5. Check construction, qualification evidence, and acceptance criteria.
6. Model and test the final circuit before approval.
Balancing reliability confidence against cost means testing what the application stresses, and no more.